Bollinger Bands: How to Use and Interpret Them Correctly
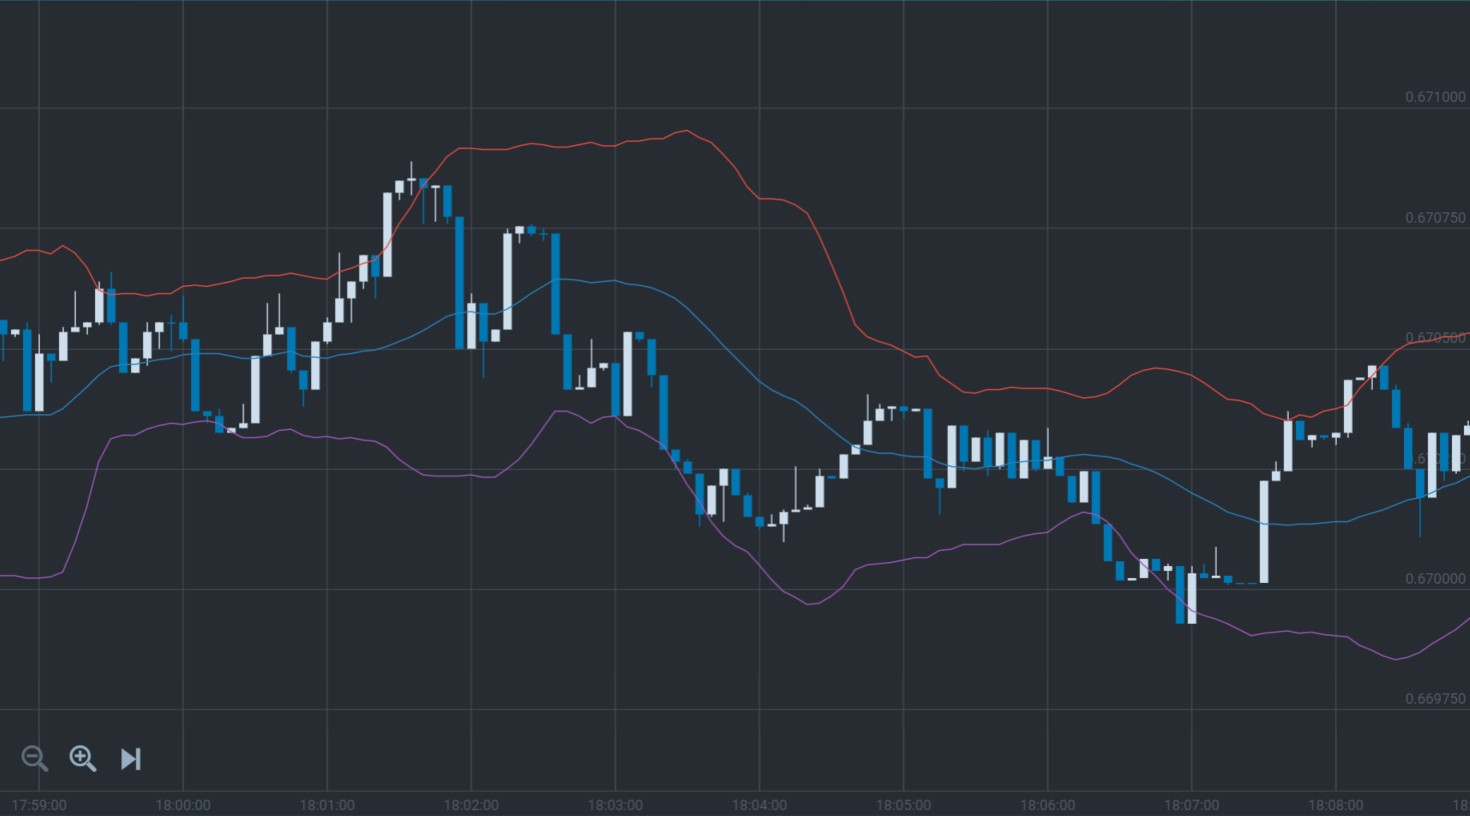
Bollinger Bands are a widely used technical analysis tool that helps traders identify potential market trends and volatility. Developed by John Bollinger in the 1980s, they consist of three lines plotted on a price chart: a simple moving average (SMA) in the middle, and two bands (an upper and a lower) that are placed two standard deviations away from the SMA. These bands expand and contract based on the market's volatility, offering insights into price movement and potential trading opportunities.
To find out more click on the link https://invest-forum.com/Threa....d-Bollinger-Bands-Ho
How Bollinger Bands Work
The Middle Line (SMA)
The middle line of the Bollinger Bands is a simple moving average, typically set to 20 periods. This moving average smooths out price data over a specified time frame, making it easier to identify overall trends. It serves as a reference point for the price action.
The Upper and Lower Bands
The upper and lower bands are calculated by adding and subtracting two standard deviations from the SMA. The bands widen when volatility increases and narrow when it decreases. These bands act as a dynamic range within which prices are likely to move, providing traders with a visual tool to evaluate potential buy or sell signals.
Volatility Measurement
Bollinger Bands are primarily used to measure market volatility. When the bands are wide apart, it indicates high volatility, and when they are close together, it signifies low volatility. Traders can use this information to gauge market conditions and adjust their strategies accordingly.
Double Bottoms and Double Tops
Traders can use Bollinger Bands to spot chart patterns like double bottoms and double tops, which are potential reversal signals. A double bottom occurs when the price touches the lower band twice with a small rebound in between, signaling a potential bullish reversal. A double top happens when the price touches the upper band twice with a brief pullback, indicating a bearish reversal.
Conclusion
Bollinger Bands are a powerful tool for traders looking to gauge market volatility and identify potential entry and exit points. By understanding how to use and interpret them correctly, traders can enhance their strategies and make more informed decisions. However, like any technical indicator, Bollinger Bands should not be used in isolation. Combining them with other tools and taking into account broader market conditions can help traders avoid false signals and improve their overall trading performance.
#bollingerbands #technicalanalysis #markettrends #volatility #tradingstrategies